Ryan Lenihan

Modelo Brings Presentations And Collaboration to Anywhere With a Data Connection

In the last 6 to 18 months, the 3D collaboration and visualisation world has exploded with new software solutions to make life easier. The latest contender is from a startup based in Cambridge called Modelo. Modelo is a cloud based service that allows you to view 3D models that have been optimised for your web browser, giving you the ability to view models on almost any device with a data connection. Being a cloud based service, the recipient of your model doesn’t even need to own viewing software as the model is comes to you through a series of tube and viewed entirely on the line.

You can upload any Revit, SketchUp or Rhino file to Modelo, the original file is converted to an optimised format for viewing is generated. The original file is kept on the Modelo servers, however there is the option to delete the original file after the optimised file has been created.

Modelo is impressively fast for a browser based model viewing platform. You can share models with clients and the design team no matter where they’re located, allowing the team to annotate models and discuss through an online chat system.

It’s not collaboration in the league of Revizto, It’s collaboration made simple.

2016-06-30_11-50-52

The commenting functionality is extremely well thought out, with ability to cut 3D sectional views or attach 2D images such as photos or plan views, comments can be kept private or flagged as ‘client ready’ so when you share your model on the client ready comments are displayed.

2016-06-30_12-04-11   2016-06-30_12-09-32

Camera locations are remembered in the comments as well, meaning that when a comment is selected, the model seamlessly flies around to the view the comment was created in so you see exactly what the person making the comment sees.

You can even adjust basic settings within the model, such as turning layers on and off (it uses Revit worksets) and even adjusting the location of the sun to change shadow detail in realtime. Of course with just simple sliders and the model not being located in any real space it’s a rough guide rather than daylight and shadowing simulation but the future potential is obviously there for Modelo.

2016-06-30_12-12-09  2016-06-30_12-11-54

Sharing a model is as easy as sharing a file in any cloud based hosting service, it’s as simple as a few clicks and share a link. When sharing a model you have options to restrict who can view the model and who can see model comments.

2016-06-30_11-51-59

Sharing the model also has the ability to embed the model as an iframe, you may not realise this but iframes are not just something that can be embedded within websites, but with a plugin like iSpring or LiveWeb you can even embed the live models directly into a Powerpoint presentation.

[iframe src=”https://beta.modelo.io/embedded/-3qALDF4aS?viewport=false&autoplay=true&c_at0=-1.5892244805335978&c_at1=2.5635066655517225&c_at2=-6.512211389627836&c_theta=2.003701836602553&c_phi=0.6065329251994325&c_dis=54.364789971000995″ width=”640″ height=”360″ frameborder=”0″ mozallowfullscreen webkitallowfullscreen allowfullscreen]

The example above is a small part of a project that I’ve been working on for around 12 months now. The project involves a building structure on a bridge deck which has been constructed of spans of supertee structure, the bridge team working on the project were not working in Revit so that supertee structure that you’re seeing is actually a DWG file embedded within a Revit family which has come across quite nicely. To get the colours to come through, you will need to have materials applied to your modelled elements which in this instance I have applied at a piping system level.

On top of all the collaboration features, Modelo also gives you the ability to create a virtual reality model from a Revit model. Check out the transformation from Revit to VR in the video below, Eli from Modelo demonstrates just how easy it is, going from Revit to VR in 120 seconds.

[su_youtube url=”https://www.youtube.com/watch?v=OvMOPGnl40c”]

All this is great, but what about this new fangled on the line technology? Won’t everything fall over when the data connection drops out? Well Modelo have this figured out, one the 3D model is loaded into your browser, Modelo can still be used to present regardless of if you have a data connection or not.

Finally, what does it cost? Well if you’re a personal user, it’s free. You’re limited to a single user, 5gb of storage and a maximum model upload size of 50mb. At the free tier you can still share and collaborate with others as well as create VR models. For small businesses of up to 10 users, Modelo will set you back $25 per user per month but you also get bumped 1tb of storage and model uploads of up to 1gb per model. If you need more than 10 licences you can contact Modelo for enterprise pricing as well.

I’ve only been using Modelo for a short while but I already love it. I actually prefer it to Autodesk’s web based offering. The simplicity and execution really hits the mark.

Need Bulk Family Upgrades? You’ve Got Options!

So, I’ve been asked maybe 4.. 5 times in the last week or so “How do I batch update Revit family files?” so for those that don’t know how, here is a run down of some of the options available to you

Bulk File Upgrader – US$99

Harry Mattison of Boost Your BIM has written a Bulk File Upgrader program which you can use to upgrade projects, families and templates in bulk. It costs US$99 and has a very simple to use graphical interface which basically consists of selecting the location of files in and files out.

It’s a pretty simple app, it’s built to do one thing and does it well. You can pick it up from the Autodesk App Exchange here

BIMWerx Bulk Upgrader – US$10

This is a relatively new file upgrade addin that was released just this last week.

The batch file upgrader will scan a user specified folder for project files and family files, upgrade them and save them in the same folder. All backup files are automatically removed afterwards in order not to clutter the folder that is being upgraded.

This application requires minimal input, and works great with multiple library file upgrades. You can grab it from the Autodesk App Store.

CADDaddy Tools – US$12.99

Another alternative is to think about what you want to do in reverse.

James LeVieux sells a great little addin called CADDaddy Tools, it doesn’t upgrade files, but it will export families to a folder location complete with sub-folders that reflect the element category. This is a fantastic solution if you keep all (or most) of your families in your base Revit template. Simply upgrade your Revit template or project and then use the CADDaddy Tools family exporter to export all your newly upgraded families.

You can pick and choose what categories are exported and away you go.

The best part is that CADDaddy  Tools is only US$12.99 for the latest version (2017) and gets cheaper for previous releases and for that price, you also get a few other handy tools as well. Once you’ve exported your families, if you have the Revit version as a suffix to your file names, there are a number of free file name utilities out there that you can use you rename your files to reflect the correct version.

Journal File – Free!

If you’re up for something ever so slightly more complicated than the other two options, you can use a Revit journal script. I’ve tested this to work in both Revit 2015 and 2016 and it will bulk upgrade files with ease and what’s better is you can do it for free!

First download this file and extract the contents to the root directory of your family library. I suggest you take a copy of your family library to make the changes to so you don’t lose the previous version of your families.

2016-06-22_14-43-22

Run the BatchUpgrade2016.bat file, this will start by cleaning out all of your old family backup files (i.e. family.0001.rfa) and then it will create a list named famlist_rfa.txt

Once you have the famlist_rfa.txt file, simply drag and drop the BatchUpgrade2016.txt file onto the Revit icon on the desktop. Make sure you drag it to the correct icon i.e. Revit 2016.

Now all that’s left to do is watch the magic!

adobepresenterupdate

13/10/16 – Script updated for Revit 2017 compatibility. Please re-download the file for the updated script.

Sizing AS3500 Compliant Pipework Using Revit – Part 2

An important part of domestic water design is calculating flow and pressure losses, a common complaint I have from fellow Aussies though is that Revit’s pressure loss report is it’s not in a familiar format and is not something that they’re comfortable including within their design folders. Not to mention, with the AS3500 pipe sizing work(around)flow that I posted last week, the flow rates still don’t quite match up due to the IPC vs AS3500 conversion factor.

So with a powerful tool like Revit at your disposal, why not utilise it to generate data outputs that are in that familiar format and that you are happy to drop into your design notes?

There is always old faithful – the Excel spreadsheet that performs all your calculations..

2016-05-13_17-59-59

..because it’s the way you’ve always done it, so why change right? Not a bad solution if you want to spend the rest of your career manually measuring pipework on drawings to verify your design; ultimately though this is how we came to the true “She’ll be right” Australian method of pipework sizing. After all, doing it properly takes far too long, so just go with your gut and prove your design with actual calculations later, but only if someone questions it down the track.

Did you know you can recreate basic Excel calculations within Revit schedules using calculated values? Of course you did! OK so maybe you didn’t. The problem I have with this method though is due to needing to neutralise Revit units your formulas will start looking a little.. weird.

Take the following example, comparing a simple Excel formula to it’s Revit equivelent

This

=D32*0.001/(0.7854*E32^2*0.001)*1000

Becomes this

=((AS3500_PSD / 1 L/s) * 0.001) / ((0.7854 * Diameter ^ 2 * 0.001) / 1 m²) / 1000

Which how you’d explain that to another engineer I’m not quite sure. They’d probably look at you like you’re a bit odd. So what’s the solution then? Well, maybe you’ve heard of this thing called Dynamo? It’s frequently touted as the best method to model a facade made from old chairs, but did you know that Dynamo can be used for actually useful things too?

In Dynamo, our formula is quite clean and simple, in fact if you squint a little, it looks just like our original Excel formula.

2016-05-13_11-05-15

Armed with that knowledge and a bit of time, that trusty old Excel sheet you’ve been using your whole life can be converted into Dynamo. Once you’ve got the calculations working off your Revit model in Dynamo you can generate all the data within your schedules for every single piece of pipe in your model within seconds. So do you still want to spend the rest of your life measuring pipework? I thought not..

And here are the fruits of my labor. My graph was developed in 0.9, but I can confirm it will work in 1.0 and the 1.0.1 pre-release.

2016-05-13_18-23-13

Stepping through from left to right, this is how it all works:

Starting off simple, I’m selecting all the pipework within the model.

2016-06-15_12-16-57

From there, we’re feeding the All Elements of Category node into the Element.GetParameterValueByName node. Filter out the pipework elements based on their system classification using a combination of String.Contains and List.FilterByBoolMask. This gives a set of true and false results for all of the selected elements, which in this case is our pipework. We take the “in” output of the List.FilterByBoolMask which gives only the elements marked as true.

In this instance I have used String.Contains and checking for the string water. What this means is that it will select anything with water in the name, which would include cold water, hot water, rainwater and so on. You can adjust this to filter out your pipework as you need for as many different systems as needed.

2016-06-15_12-24-58

From this point onward is where all the good stuff happens. We push our pipework out to three separate groups of nodes. A Barrie Smith lookup, velocity calculations and head loss calculations. The Barrie Smith lookup was the most difficult part as it required custom python code to perform the lookup.

2016-06-15_12-32-00

In this group, our results from the previous step feed into the Element.GetParameterValueByName node. We’re picking up the calculated fixture units from our pipework and multiplying it back out by our 3.5x multiplier from my previous post to give us our actual AS3500 compliant fixture units. The code block in the upper left generates a list which is Table 48 from Barrie Smith transcribed to Dynamo. The fixture units and Table 48 are then fed into the custom python node

2016-06-15_12-45-31

The output of the python node then feeds into a math divide node and we divide our flow rate figures by 28.317 and pushes the result to a flow based parameter that I’ve named AS3500_PSD. The reason for division is that Revit stores all units of measurement in imperial rather than metric. When inputting data through Dynamo, Revit doesn’t know that you’re inputting metric figures. What this means is that when you review your data in Revit, you have input 0.23 gallons per minute, not 0.23 litres per second.

Heading back to our second (green) step, the List.FilterByBoolMask node feeds into another Element.GetParameterValueByName node. This time we’re picking up the diameter of our pipework and we’re finding the diameter in imperial and converting it to metric using a formula within a code block.

2016-06-15_12-56-46

The metric diameter from the code block and the probable simultaneous flow rates from the third (blue) step combine first to calculate our velocity. The calculated result is converted back to imperial and populates to a velocity based parameter named AS3500_Velocity

2016-06-15_12-58-48

Our last fork from the second (green) step is to calculate our head loss for our section of pipework. The brighter pink section first takes our length. Now for whatever reason this is taken in millimeters,  so no conversion from imperial required. In the purple section we’re feeding the code block with our pipe size and probably simultaneous flow from previous steps to calculate headloss per 100m, then another code block to calculate headloss for the section of pipe. Finally we push our headloss calculations into their respective parameters AS3500_Headloss and AS3500_HeadlossSection.

2016-06-15_13-09-26

When you’re finished, you end up with a schedule you can drop on your drawing or export to Excel for design verification, and it’s all calculated as you model and far more accurate than you would have ever provided before.

2016-05-12_23-35-53

The example that I’ve used here is highlighting flows where the velocity falls outside the acceptable range of AS3500, so you have a simple visual prompt that you need to check your design. I have found though that most of the time, the design is correct and the sections of pipe highlighted are either 15dia supplying a single fixture with a velocity greater than 3.0m/s or 20dia with two fixtures connected with a velocity of less than 1.0m/s.

Give it a go yourself, once the Dynamo portion is humming along your return of investment is incredibly quick.

Filtering Schedules

I had a question earlier in the week via Linkedin from Marvin, the question was

Ryan, I was wondering if you could tell me how do I split my schedules per level?

It’s a question that crops up eventually for most users, and it’s an easy one to implement.

Tucked away in the list of parameters you can work with is the Level parameter, Simply add it to your list of scheduled parameters. My example will be scheduling plumbing fixtures. I’m scheduling the Family and Type and Level built in parameters as well as a shared parameter that I have created named FixtureAbbreviation.

2016-06-15_17-21-19

My schedule lists out all the toilets in my model and is showing me what level they’re sitting on, you can see that I’ve highlighted elements on level 0 in yellow and elements on level 1 in a red-ish colour.

2016-06-15_17-22-59

Now I have this information, I have a few different options to work with to separate elements by level. First, I can group my elements by level in a single schedule. To do this I simply open the Schedule Properties dialogue and head to the Sorting/Grouping tab.

2016-06-15_17-30-25

From here, choose Level from the drop down list. You can choose to sort the groups in ascending or descending order, insert blank lines between groups or add headers and footers to each group as well. You can see in the example below, the schedule has been grouped by level and a blank line has been inserted splitting the groups.

2016-06-15_17-33-31

The other option is to filter by level, when doing this you’re going to create a schedule per level, meaning that any elements that don’t match the filter won’t appear in the schedule. This is great for showing the number of items on a level, in the past I have done this for plumbing fixtures and sprinkler heads.

To filter by the level, head back to  the Schedule Properties dialogue and head to the Filter tab. First select the Level parameter and then choose the level you want to filter by.

2016-06-15_17-39-18

In this example, I have filtered my schedule by Level 0. You can see that the schedule now only shows those elements located on Level 0.

2016-06-15_17-42-35

You can quickly replicate schedules for other levels by duplicating the schedule, renaming it and then changing the level it is filtered by.

2016-06-15_17-43-57

When working with schedules, you can filter and sort by almost any parameter available to you, the main exception is also the most annoying one, you can not filter your schedule by your family type name. An easy way to work around this is to utilise another parameter that is consistent for that family type, in my example if I was to filter or sort based on individual plumbing fixture types, I could use my FixtureAbbreviation shared parameter.

Schedules have a lot of uses and are really quite powerful once you get your head around them.

Sizing AS3500 Compliant Pipework Using Revit – Part 1

For Australians that have tried working with the pipe sizing tool within Revit, you would know that Revit doesn’t quite size things right. In fact it over sizes the pipework and calculated pipe sizes can get out of hand.

I had the pleasure to speak about this topic at the 2016 Revit Technology Conference (RTC) back in May where I demonstrated a simple workflow that sizes domestic water pipework to AS3500 compliant sizes. The main goal of the demonstrated workflow was to keep things as simple as possible, which I guess ends up making it a workaround rather than a true workflow, but it something that everyone is able to get access to without knowledge of coding for the Revit API.

How do you size pipework?

Most Australians use a few tried and true methods. Those being AS3500.1 using the pipe sizing tables in Appendix C, the book Selection & Sizing of Copper Tubes for Water Systems otherwise known as Barrie Smith’s Blue Book. Some of you probably even just size off the top of your head with a confident “She’ll be right!” and you’re done.

Verifying all of that design data by hand is not that easy though, so why not use Revit? You can verify your design on the fly and be confident that your documents are compliant with Australian Standards.

How does Revit size Pipework?

2016-04-26_15-37-09

If you know where to look, it doesn’t take long to figure out how Revit sizes domestic water pipework; it uses table E103.3(3) of the International Plumbing Code (IPC). Just like AS/NZS3500 and Barrie Smith, the IPC provides a table that can be referenced to convert loading units (fixture units in Revit) to a probable simultaneous flow.

Comparing extracts of both the IPC and AS3500, we can start to analyse the differences between the two standards. The conversion rates are 1 gallon = 3.785 litres, therefore 1 gallon per minute is 0.063 litres per second.

2016-04-26_16-21-35

2016-04-26_16-31-40

Based on the IPC sizing charts, 1 fixture unit is 3 gallons per minute, or 0.18l/s whereas in AS3500, 1 loading unit is 0.09l/s. To give a better understanding, this is how the figures compare visually.

In the image, the IPC is blue, AS35000 is orange and Barrie Smith is green. What interested me the most is that many hydraulic designers have told me “I don’t use Barrie Smith as his results oversize the pipework” but you can see in the comparison that Barrie Smith and AS3500 are almost identical, with AS3500 actually returning probable simultaneous flow rates higher than that of the Blue Book from around the 22 fixture unit mark.

So the IPC probable simultaneous flow rates far exceed that of the Australian Standards, but is there any correlation between the two? For the large part, there is; again it is easier to show visually.

By simply taking the IPC flow rates in litres per second and dividing the figure by AS3500 flow rate in litres per second to compare the two, we get a clear picture of how many times greater the flow rate the IPC is compared to our local standards. The IPC peaks at about 3.6 times the flow at around 10 fixture units and then tapers off towards 3 times the flow compared to Australian Standards.

The mean value across all the figures works out to a multiplier of around 3.2, however looking at the data I most frequently verify manually, it is generally branches of 10-40 loading units, taking the mean value of this range, the multiplier between the flow rates sits at 3.46.
dbc97d3b537a3b38f323b2cd9e97228de9342018e72bb18e3b36ec235a8783f5

Besides the incorrect use of a meme or two, what it all means is that we can make some simple tweaks to our family content to start using the Revit pipe sizing tool for Australian Standard compliant pipework.
2016-05-13_22-58-43Taking my plumbing fixture family, I added the parameters AS3500Multiplier, AS3500LoadingUnits and an optional yes/no parameter IPCtoAS3500 each of these parameters do the following:

AS3500Multiplier – the multiplier to convert between IPC and AS3500, I used 3.5
AS3500LoadingUnits – the actual loading units, in this case I used 2.
IPCtoAS3500 – when set to true, it adjusts the out of the box Revit parameter CWFU

In the CWFU parameter I used the formula if(IPCtoAS3500, AS3500LoadingUnits / AS3500Multiplier, AS3500LoadingUnits)

Basically, if the box is checked, we’ll divide 2 loading units by 3.5, if it’s not checked, the loading units will remain 2. There is no real reason to do this if you’re only sizing within Australia or New Zealand, but if you want to use the same set of families across both standards, this is how you would go about it.

Taking a simple example of 15 toilets on a single branch, using Revit to size the pipework, we end up with pipework that is somewhat oversized, the the main branch being sized up to 32mm diameter after 9 toilets.

2016-06-13_15-14-52

I have a Excel sheet where I transcribed table 48 from the Blue Book, filling that sheet out with our fixture count, we can see that if we’re only taking into account velocity requirements when sizing our pipework, 32 diameter is quite oversized even for 15 toilets and that 25 or even 20 diameter would be a more acceptable size.

2016-06-13_15-19-532016-05-05_9-06-53combined

To verify my Excel figures, here is an extract I’ve scanned from the Blue Book, you can click on both images for full size.

Using our reduced fixture unit ratings however changes things quite a bit. With our fixture units divided by 3.5, we get more realistic results, the pipework being sized to 25mm diameter after 10 toilets and remaining 25 diameter for the rest of the run. Referring back to our Excel/Blue Book references above, we now have Australian Standard compliant pipe sizing!

2016-06-13_15-27-47

You might be thinking though, this is a small scale example, does it work on a larger scale? In the example below, each box represents a group of fixtures totaling 100 fixture units each.

2016-06-13_15-45-30

So each individual branch is providing 100 loading units and the total provided on this run is 500 loading units. We divide these figures within our plumbing fixture families by 3.5 to give our reduced rates for Revit sizing and once again our pipe sizing is on point with a size of 32mm generated by Revit. Referring back to the Blue Book, we can see that 32mm gives a velocity of 1.482m/s which falls within our AS3500 range.

2016-06-13_15-42-27

Further reviewing our sizes with the Blue Book, we can see that 500 fixture units will flow through a 50 diameter pipe at a velocity of 1.774m/s.

It’s really that simple. You can use any multiplier to suit your needs, but after extensive testing, a multiplier of 3.5 gives consistent results across many different designs where I have used Revit to size AS3500 compliant pipework.

In the next article, I’ll show how to use Dynamo to perform further calculations for design verification purposes.

No Space Name Utility? No Worries!

Sitting in Dan Stine’s lab at RTC AU 2016 and in true to RTC form, a piece of software he wanted to show wasn’t installed. In this instance, it was the Space Name Utility, a subscription centre app that not everyone would have access to.

We were however using Revit 2017 which comes with Dynamo pre-installed, but why does this matter? Because you could build your own space name utility in less than a minute.

When Revit MEP spaces are created, the room data is already mapped to the space, but it’s not associated with the space parameters. All you need to do in dynamo is to get the value of the Room Name parameter and set that same value as the Name parameter and the Room Number to the Number parameter.

2016-05-13_16-31-03

It couldn’t get any simpler with Dynamo really and it’s actually a really good exercise for those new to Dynamo who are wanting to figure out how it all works.

2016-05-13_16-06-30

Or, if you’re lazy you can just download the Dynamo file here

Updated Conversion to Metric Script

This is something that I haven’t used in a while, but it seems a lot of people out there find this quite handy. The script I had posted previously was for Revit 2014, I had not used it in 2015 and was only alerted to the fact it didn’t work this week, I thought I’d check it out and it’s an easy solve.

The instructions on how to create the script still apply if you want to generate your very own journal scripts, but for those of you that simply want to start converting families to metric right now, I have made the updated version available for download here.


As a refresher, here is the youtube video that shows how it all works

[su_youtube url=”https://www.youtube.com/watch?v=keQr2bqtyu4″]

How to Fix the ‘Stacked Wall’ Error When Loading Families Into Revit

At some point, you’re probably going to look like this guy – loading a family and you’ll be struck with the error “Last type in system family “Stacked Wall” cannot be deleted. ” and pulling your hair out.

2015-11-30_16-26-03

What makes things more confusing is that the family that you try to load will likely have nothing to do with stacked walls, in fact both times I’ve had the problem has been with title block families.

To fix the problem, you need to open up your journal file which for 2015 is located at

Windows XP: %USERPROFILE%\Local Settings\Application Data\Autodesk\Revit\<Product name and release>\Journals
Windows Vista, Windows 7, Windows 8: %LOCALAPPDATA%\Autodesk\Revit\<Product name and release>\Journals

Once in the journal file, search for the term ‘ 0:< DBG_WARN: which is where the information you’re looking for starts. The following is from my journal file:

Jrn.Data “TaskDialogResult” _
, “You are trying to load the family Project-A3 SHEET, which already exists in this project. What do you want to do?”, _
“Overwrite the existing version and its parameter values”, “1002”
‘ 0:< DBG_WARN: Family contains category id -2009630, gstyle type 2, gstyle id 558659. That category id and gstyle type map to a gstyle id of invalidElementId in the project. (In practice, this is most commonly caused by a mismatch between the version number passed to addNewGStyles and the version number in the table in ProjectStyles.cpp, due to an incomplete renumbering of an upgrade.): line 503 of d:\ship\2015_px64\source\revit\revitdb\settings\GStyleElem.cpp.
‘ 0:< DBG_INFO: Write access to host’s DocumentHistory from content doc: line 4573 of d:\ship\2015_px64\source\revit\revitdb\document\Document.cpp.
‘ 0:< Unnecessary nesting;Family\FamilyDocument.cpp;642;FamilyLoad__UpdateReplicasInSmallDoc;N++EB(NB);
‘ 0:< Error posted:
‘ 0:< Last type in system family ‘Basic Wall’ cannot be deleted.
‘ 0:< Error posted:
‘ 0:< Last type in system family ‘Stacked Wall’ cannot be deleted.

In this instance there are 2 item id’s that are listed, you may have quite a few more than just two. Either way what you need to do is open up your family and using select by id tool, select and delete the elements listed as causing the problem.

2015-12-07_10-34-46Once the items are deleted, purge and audit for good measure and load back into your project.

Job done!

Revit to Excel With Included Column Headers Using Dynamo

I recently received a follow up question to my Revit to Excel Dynamo post asking how to add header to the exported Excel file.

…when the data is extracted to excel is it possible to have the parameters come across and act as headers within the excel document? Is there a process with Dynamo to do this?

I’d never actually looked into how to do it, but it’s a good question for sure. I had a look around the web and there were plenty of solutions that didn’t really seem to work, or to me seemed to be far more cumbersome than they needed to be. This is the second iteration of my solution, which is far more streamlined than what I came up with initially yet achieves the same results.

revised hedaer list

Coming in on the left hand side of the image is the strings defining the parameter names from my Revit to Excel Dynamo post feeding into a List.Create node. I’ve added the additional string GUID string feed into index0 as in the previous example I didn’t need to define the GUID string. The Flatten node that you can see is fed by the List.Create node from the Revit to Excel Dynamo post that builds up the list of parameters to export.

Next comes a simple code block where I have entered the code {list1,list2}; Simply wire up each list in the order you want them to join in and then finally, feed the code block into the data port of the Excel.WriteToFile node.

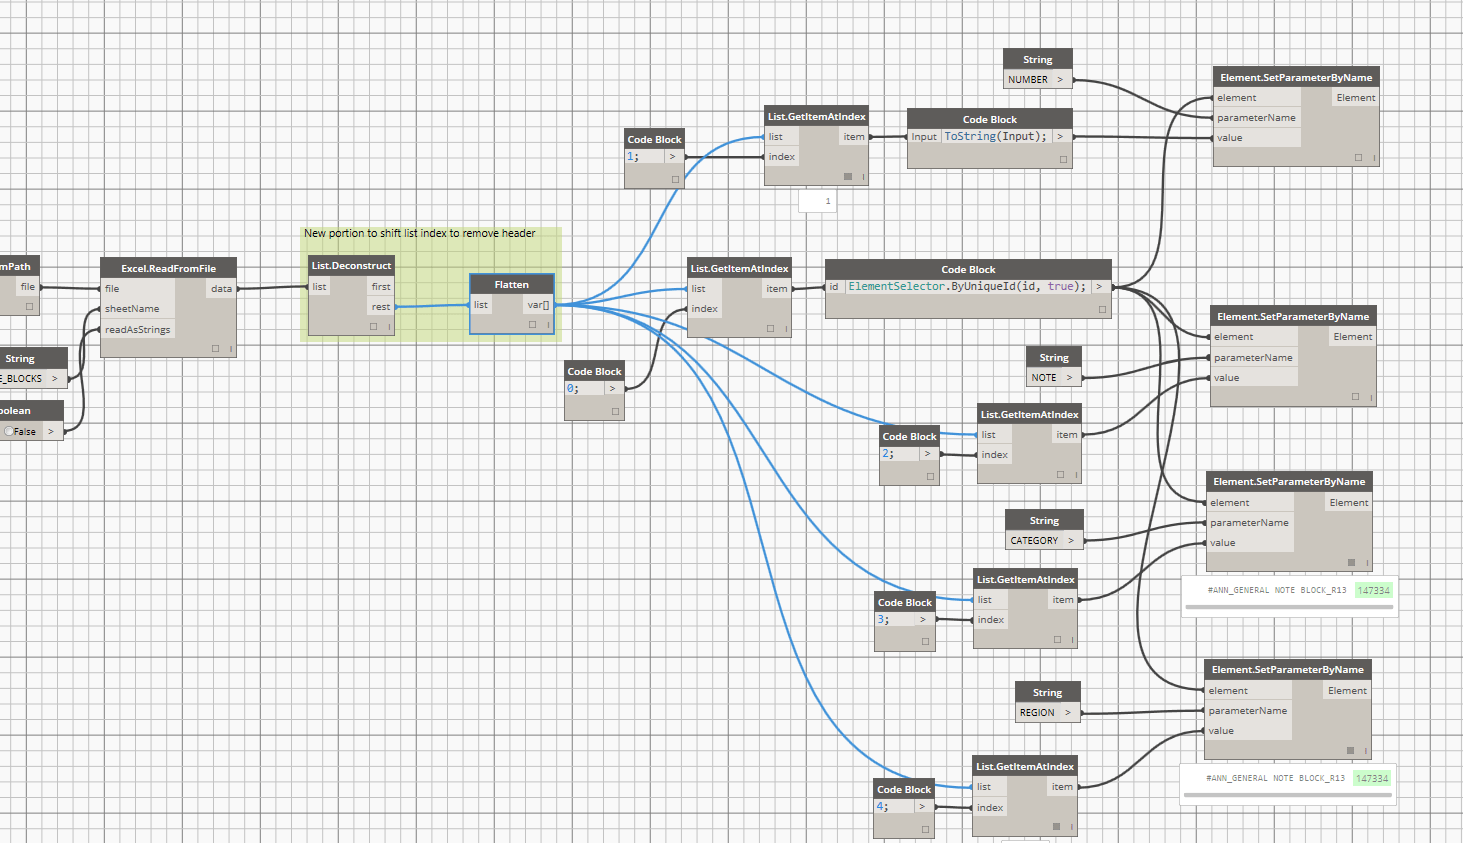
On the way back in it’s just as simple, I’ve used List.Deconstruct to drop the first row of the list, which is our headers. I’ve then used Flatten to convert the list to a usable format so we can pull the data for each family, the rest is exactly the same as before.