Ryan Lenihan

Taking a Return Trip From Revit to Excel Using Dynamo

Last week I wrote about using note block schedules to create specification sheets and I explained how you can use addins such as BIMLink, custom macros or C# addins or Dynamo to get the data out to Excel so that it can be edited by an engineer and then re-imported to Revit from Excel.

Problem is, you don’t have a BIMLink licence, you don’t know how to code in C#, the most accessible method for you to achieve this workflow is Dynamo but you don’t even know where to start; never fear! In this post I explain how to create a bi-directional link between Revit and Excel using Dynamo using the as the note blocks from my previous post as an example.

I’ll be using Dynamo 0.80 which can be found on the Dynamo BIM download page.

Exporting from Revit to Excel

The export to Excel process is pretty simple, you just need to think about the logical steps that you need to take. You want to select the family you wish to export data from, select the parameters to export, organise them in a list and then write it to the Excel file itself.

To step through the process, first select the family type and push that into an All Elements of Family Type node.

2015-06-11_12-33-39


From there we start our first step in taking care of the family unique identifier by using the Element.UniqueId node, this will export the family’s GUID. Simply link the All Elements of Family Type node to this one. You need to export each individual family’s unique identifier as well, if you don’t, as the BIM Troublemaker discovered you may end up importing the wrong data to the wrong family.

Next, you need to select each of the parameters you want to export, for this you need to use the Element.GetParameterValueByName node. Link the All Elements of Family Type node through to this node and you will also need to add a String node which is where you input the name of the parameter. Because I’m using the annotation family from my note block post, the parameters that I will be exporting are NUMBER, NOTE, CATEGORY and REGION. Note that the value that you enter into the string is case sensitive and that you need to repeat this for each parameter you are wanting to export.

2015-06-11_12-33-50

Now you need to push the output of each of our Element.GetParameterValueByName nodes through to the List.Create node. This will actually create a list that will run the parameters across the page with each parameter being spread across a row instead of being arranged in columns. If you exported the data to Excel at this point, you would end up with something that looks like this:

2015-06-11_12-46-17


However this isn’t how we want to work, we like our data arranged in columns. To do this, use the List.Transpose node which swaps the rows and columns in the created list.


To finish off we need to use the Excel.WriteToFile node in which we pass through a File Path node, a String which names the Excel sheet and a few Numbers which gives the starting row and column of our excel sheet.

The result is a nice, easy to read export of all the data relevant to our note block schedules ready to be modified by an engineer.

2015-06-11_12-56-52


At this point you can use the Sort function in Excel to sort your Excel file into a usable list. In this instance I have chosen to sort by Column D and then Column B so that I am sorting first by category and then by note number.

2015-06-11_14-18-21

Importing back into Revit from Excel

Once the engineer has finished modifying the Excel sheet, we’re ready to bring the data back into Revit from Excel. This process is slightly more cumbersome but overall not a whole lot more difficult than the export process.

2015-06-11_13-24-16

First we need to pick up our Excel file, start with the File Path node that we used before, before we go to the Excel.ReadFromFile node though we need to pass the file path through the File.FromPath node otherwise it will not work. We also need to add a String so we can tell Dynamo which sheet to read. Next, pass the data back through the List.Transpose node to get the data back into a format that Dynamo and Revit are happy to work with.

2015-06-11_13-27-55


Remember earlier I mentioned during the export process that to make sure we’re writing the correct information to the correct family we need to index our list and the families by their GUID? Thanks to the BIM Troublemaker, we know how to select each element from our Excel file based on the GUID. First, start with a List.GetItemAtIndex node and connect the List.Transpose node to it. Next, add a Code Block node and enter the text 0; this passes through the number 0 as our row index. Finally, add a Code Block node and insert the code  ElementSelector.ByUniqueId(id, true); this is case sensitive, so make sure that you enter it correctly or it will not work!

2015-06-11_13-35-13


Finally, we need to push the data through to each parameter for each individual family. To do this, use an Element.SetParameterByName node. We need to feed the ElementSelector Code Block that we created into our node, along with a String node that matches our parameter name, remember this value is case sensitive and finally we need to link up our value via a List.GetItemAtIndex node.

The List.GetItemAtIndex node needs to be told which row to use to pull it’s data from, this is as simple as adding a Number node. Don’t forget though that the first row is at index 0, which is where we are pulling our GUID from, so we want to pull our first series of parameters from the row which is at index 1.

In this instance our index 1 is our number list which you may not need to import this so you could skip this step, but if you do need to populate the number data and you try to feed the parameter from the List.GetItemAtIndex node directly to the Element.SetParameterByName node Revit will throw back an error stating that “The parameter storage type is not a number”. Originally I tried to overcome this by using the node String from Object but this gives a number to 3 decimal places and we don’t want to see this on our specification sheet. The solution in this instance was to first use the Math.RoundDownToPrecision node from the Clockwork package which you can download from within Dynamo itself or from dynamopackages.com. We need to pass a number to the Math.RoundDownToPrecision node to indicate the precision we want, which in this case we want a precision of 1.

The number conversion is the only oddball of the parameters that we’re working with, the rest of the parameters simlpy feed the List.GetItemAtIndex node directly to the Element.SetParameterByName node. Repeat for each parameter that you want to populate.

2015-06-11_13-44-43


And to finish up, our results:


Using Note Blocks for Project Specifications

Quite a while ago I was looking for a solution for specification drawings, they crop up from time to time on small jobs when a separate specification document isn’t required.

The problem with these specification drawings though is that the content of the text usually started life in AutoCAD, then it’s imported and roughly tidied up in Revit, it’s usually copied and pasted from one job to the next and you end up with text that is cumbersome to modify and information irrelevant to the current project.

The answer to the problem is note blocks, in my opinion a brilliantly clean solution. The annotations can be placed neatly on a drafting view, the content of the annotations is then scheduled and you end up with a series of schedules that are easily arranged on your specification sheets. Modifying can be as simple as the modeler editing the text within the annotations or  the content can be exported using BIMLink, Dynamo, custom C# macros or addins ready to be modified by the engineer and re-imported to Revit.

I was working at another company when I put together a demonstration project, did a short presentation on how it works and was flat out told “No. This solution is too difficult for the average user.” And that was the end of that. We continued trundling on with cumbersome, incorrect and generally backward methods of creating and maintaining specification drawings.

I briefly mentioned this method for specification sheets in a Reddit post and I was asked how this works, so with that glimmer of hope that someone might find it useful, this is how you go about it.

First, start with a generic annotation. This is simply for display on your drafting view and of course to hold the data in for your schedules. Mine simply looks like this

2015-06-10_9-26-46

Each of these labels are a simple instance family parameter.

2015-06-10_9-24-49

The parameters I used were

  • Number – Used to order the notes
  • Note – The note itself
  • Category – This is used for each heading in the specification sheet. For example in hydraulics this could be Stormwater, Hot & Cold Water, Drainage etc. or for electrical it could be Lighting, Power, Lightning Protection etc.
  • Blank Spacer Left and Right – These are to give a cleaner look to the note blocks on the sheet, they’re personal preference only.
  • Region – I had to deal with region specific notes both within Australia and also internationally.

Once you have the family loaded into a project, create a drafting view to arrange your annotation symbols. Mine looked like so

2015-06-10_9-38-36


I manually typed in the headers that you can see just for my own reference, the headers aren’t required though as all the required information for scheduling is contained within the families themselves.

The next step is to create the schedule itself. If you’re not aware, the note blocks can be found under the schedule drop down on the ribbon.

2015-06-10_9-43-34


You will then be prompted to select the annotation that you want to schedule.

2015-06-10_9-45-12

From there, select all the parameters associated with the annotation that you need for your schedule.

2015-06-10_9-46-10


Filter out the annotations you need for this particular block of notes, in this instance I am working with hydraulics acoustic notes for Queensland.

2015-06-10_9-46-22


Sort by the number, formatting and appearance is obviously up to you and your documentation standards.

2015-06-10_9-46-30


Rinse and repeat for your remaining categories. My project ended up looking like so

2015-06-10_9-50-34

It takes a little bit of time to setup, but once you’re done future modification is simple and if you don’t need to modify the notes, even better! If you’re worried about template clutter, the schedules don’t need to live in your base template either, they can be located in a separate *.RVT file where all the standard notes and schedules are kept and can then be imported to the project as required.

The result is a clean, easy to organise specification sheet. If you don’t want a particular section, it’s quick to remove and re-align the remaining parts. If you don’t want a certain note to show up, you can filter it out by changing the number to xx or delete it from your drafting view. Engineers can confidently take responsibility for what is on their drawings without worrying about typos, misreading of hand markups or information hanging over from previous projects.

2015-06-10_9-52-02

And finally, you can see here how the blank left and right parameters affect the schedule. As mentioned previously these are entirely optional, I just liked the resulting layout of the notes.

2015-06-10_10-23-26

To get you started, you can download my example annotation family here

Navisworks Quick Tips

I’ve been focusing a lot on documenting Navisworks procedures at work of late, for whatever reason Navisworks seems to be seen as some black magic witchcraft software package that no one wants to admit that they don’t entirely understand how to drive.

I sat in on a Navisworks session at the Revit Technology Conference last week just to see what others were up to and there was a surprisingly large turn out. The content presented was very much in line with my previous Navisworks articles and quite a few attendees seemed to be new to how Navis..works.

Helpful Tips

So based on that, I have two quick tips for Navisworks users, the first is selecting elements with a mouse click. When selecting elements in Navisworks, you might be selecting faces of elements or even the entire file rather than the whole element.

You can change what you select when clicking by heading to the Home tab on the ribbon and then heading to the Select & Search panel. Click on Select & Search and you will now see a drop down box.

2015-05-26_9-10-01

You can then choose what you want to select with your mouse clicks. If you want to select individual elements, you will want to choose First Object.

2015-05-26_9-09-49


The second tip is about the data that you export to Navisworks from Revit. You may remember in my Navisworks 101 series that I spoke about improving your clash detection with selection sets. To create really powerful selection sets, you need the data to drive them but you need to make sure that you’re exporting that data in the first place.

To correctly export Revit parameters to Navisworks you need to make sure you have the option Convert element properties checked – by default this setting is turned off.

You can find this option in two places. The first is Navisworks itself. Head to the application menu and select options.

2015-05-26_9-30-56

In the options dialogue box, in the left hand sidebar find File Reader and then select  Revit from the list, then from the options in the right hand window, check Convert element properties.

2015-05-26_9-30-33

You can also find this setting in the Navisworks exporter addin within Revit itself. Simply head to the Addins tab on the ribbon, then from the External Tools list choose Navisworks 201xright_circular-32Navisworks Settings and then check Convert element properties

The difference between the information you get in Navisworks when you change this setting is chalk and cheese.

With the setting unchecked

2015-05-26_8-53-12

With the setting checked

2015-05-26_9-02-36

As you can see, checking this setting will export additional parameters and properties related to the element including material information, associated level, shared parameters and much more.

Having this information available within Navisworks will allow for more accurate selection sets to allow for better clash detection results as well as time lining and quantities.

Modifying That Journal Script to Actually Reduce Family Sizes

A long time ago I was looking for a solution to automatically purge a folder full of families, if like me you had a quick search around the interwebs you would have found this purge script that utilises journals from Revit Randoms that I mentioned in my previous post about converting files from imperial to metric.

Some people however report that the resulting files saved are anywhere up to 30% larger in file size after purging, personally I have seen files more than double in size after running them through the script and considering the idea of purging a file is to make it smaller, larger file sizes are just not a result that you should accept.

Some suggested to repeat the following code at the end of the script 3 times to act like a compacted save

Jrn.Command “Internal” , ” , ID_REVIT_SAVE_AS_FAMILY”
Jrn.Data “File Name” , “IDOK”, namepath

But that never made any difference for me either.

You may have noticed though when you save a file as another name, the compact file option is automatically checked which in turn results in a smaller file by default, when simply saving the file over the top of itself, the compact file option is not selected and you can not select it using journal scripts, trust me I’ve tried!

Sure it means a little bit of extra work, but the simplest way to achieve this is to modify line 108 of the script to read

Jrn.Data “File Name” , “IDOK”, namepath & “_new.rfa”

The script is the same format of the SP.Writer code that I previously wrote about, the & “_new.rfa” simply appends _new.rfa to the end of the file name and path, meaning if you have a file named c:\upgrade\family.rfa it will be saved as c:\upgrade\family.rfa_new.rfa

If you’re upgrading files to a new release, you could even change the code to & “_2016.rfa” and when 2016 is finally released you have upgraded files without the risk of accidentally losing the previous version.

There are probably cleaner but more complex ways to do this, but for the purpose of keeping the excerise as simple as possible by only adding 10 or so characters to a single line of code, this works perfectly fine.

Helpful Tips

If you don’t add the *.rfa extension, you won’t be able to open the purged files afterward even after renaming to *.rfa.


Once the script is completed, all you need to do is separate or delete all the *.RFA files and rename the *.RFA_new.rfa files back to *.RFA, you could automate renaming the files with a tool such as Better File Renamer or a free alternative such as Bulk File Rename Utility.

The files I’ve run through the script are families that have geometry imported from Solidworks models, even though not the greatest of examples, you can clearly see the improvements of this simple change.

As shown in the screenshots below the files started out at 1.34gb, after running the unmodified script on them, the increased in size to 1.7gb, after running the modified script over the original file, they reduced to 920mb.

2015-03-26_14-32-29

An extra few minutes work but the process still remains mostly automated and you have the bonus of actually achieving the desired solution of smaller file sizes which makes it absolutely worth it.

Using Excitech Tools to Create Coordinate Schedules

Have you ever adventured into the land of site works in Revit and needed to provide contractors with eastings and northings but not known how to go about it?

There is a great way to do it with a free addin from Excitech called The Revit Toolkit. You need to create an account with Excitech to download the addin, but it is otherwise free of charge.

Due to limitations with Revit family categories, Excitech can only work with some element types so because of this, I have decided to use the Telephone Devices family category for what I will call my Excitech Marker however you can use any one of the supported family categories that you like, just make sure that you set the marker family to shared in the family categories dialogue.

2015-03-20_9-56-35

The marker itself is just a simple small extrusion; mine is a 50dia x 15mm cylinder that resembles a hockey puck. You could also use model lines however I wanted to be able to see the marker in all views, not just floor plans.

2015-03-20_8-59-04

Within the family, I have added a shared parameter named ITEM_ID, the parameter is an instance parameter and I’ve placed it under the Identity Data group. The ITEM_ID parameter is included so that you can easily identify an item, in the example of a pit it would be the pit number. You can use any suitable parameter that you have created previously.

2015-03-20_9-03-23

I’ll save a master copy of this family as EXCITECH_MARKER_X_R15.RFA. The X will later change depending on what family we are nesting the marker into as this will allow us to sort our schedule far easier. As you can see in the screenshot below, I’ve nested the marker into a hydraulic pit family and renamed the nest marker family EXCITECH_MARKER_GRATED PIT_R15

2015-03-20_9-12-01


I’ve also added the same ITEM_ID shared parameter as an instance to the hydraulic pit and mapped it through to the nested marker.

2015-03-20_9-18-38


Once done, load the family into your model, I’ve placed mine in an example model at varying locations.

2015-03-20_9-25-30

The next step is to create the coordinate schedule itself. First, you want to select the create parameters button in the Excitech Toolkit and select the family category that you decided to use from the list. This will create parameters named ExcitechX, ExcitechY and ExcitechZ and associate them with your selected family categories.

2015-03-20_9-54-41

Next you want to select your settings from user options in Excitech Toolkit. Make sure that you again select the category to publish coordinates to and then choose either project or survey coordinates, you most likely want survey coordinates but it will depend on your project setup.

You can also choose when you will be prompted to update the coordinates, however I’m leaving all these unchecked.

2015-03-20_9-59-31

Finally, click on coordinate schedule to publish the coordinates to the Excitech parameters.

2015-03-20_10-14-23


To finish up, we want to configure our schedule, remember the schedule is for whatever family category you made your marker, in this example even though we are scheduling the coordinates of hydraulic pits, the category of our marker is Telephone Devices.

2015-03-20_9-53-51

Select all the relevant parameters for the schedule. I have selected ITEM_ID, Family and Type, ExcitechX and ExcitechY which are all highlighted in yellow below. The parameters that are highlighted in blue are calculated values.

2015-03-20_10-03-42


The reason I have the calculated values is that site works contractors will usually work in metres rather than millimetres like a building services contractor would. The calculated value is a length parameter and simply ExcitechX * 1 and ExcitechY * 1. Multiplying by 1 is required t convert the Excitech number parameter to a length parameter.

2015-03-20_10-02-28


Under the sorting and grouping tab, sort by Family and Type and then by ITEM_ID. If you’re scheduling different types of elements and therefore different marker family names, check the blank line box after Family and Type, this will give clean separation in your schedule between different element types.

2015-03-20_11-22-45


Next, hide the Excitech parameters from your schedule as well as the Family and Type parameter.

To match the standard accepted format of coordinates in metres with 3 decimal places simply change the format of the calculated values to reflect.

2015-03-20_10-04-03


Your schedule output should look something like this


You can locate your newly created coordinate schedule on one of your drawings or alternatively you can also export your coordinate schedule to a *.CSV file using export -> schedule to format or distribute as required.

2015-03-20_11-32-20

Navisworks Clash Detection 101 – Part #3

Part #3 – Understanding Clash Types and Tolerances

One of the most misunderstood parts of Navisworks clash detection is the settings for the clash type and the tolerances. Using the model from my hydraulic pipe sizing article I have put together an example of the different clash detection types at varying tolerances. I’ve added some columns to the model which are progressively offset at 25mm intervals. You can clearly see that there are columns that clash, and columns that do not clash with the drainage pipework.

2015-03-07_17-04-532015-03-07_17-04-00


I’ve then created two selection sets as explained in the 2nd part of my clash detection series, one for columns and one for the drainage pipework. I have then created a series of clash detection rules that clash the columns selection set against the sanitary drainage selection set, the clash reports repeat at different intervals.

2015-03-07_14-06-38

For the hard and hard conservative clash reports, I have selected tolerances of 10, 20 and 50mm and for the clearance clash report, I have selected tolerances of 20, 50 and 100mm. When running the clash reports, I get the following results:

2015-03-07_14-07-15

As you can see, as you increase the hard clash tolerance, the clashes reduce and as you increase the clearance tolerance, the clashes increase.

Hard clashes are as the name implies – a hard clash but as you adjust the tolerance, the clash is ignored within that tolerance range. Allowing for a 50mm hard tolerance means that two items need to intersect or clash by 51mm or more before they are reported on. The clash shown below has been reported in our 10 and 20mm tolerance reports, but completely ignored in our 50mm report.

There is no denying that this is a clash, yet it’s not reported in the 50mm tolerance test at all.

2015-03-07_17-35-55

Clearance clashes are the exact opposite of a hard clash. Clearance clash reports check elements for minimum clearance requirements. In a clearance clash test with a 50mm tolerance, two elements will need to be 50mm apart or closer to be reported as a clash. This is particularly useful when you want to allow additional clearance for pipe, cabletray or duct hangers and brackets that have not been modelled.

As you can see in the reported clash below, the two elements do not intersect at all, yet they are still reported as a clash due to the minimum clearance not being met.

2015-03-07_17-47-52

But What if my Elements are smaller than my tolerance?

That’s actually an interesting question and can prove useful or troublesome in clash detection reports. I’ve added a 20mm gas pipe to my example model which in plan intersects with my 15mm cold water droppers that run to each basin. Again, you can clearly see that the newly added gas pipework clashes with the existing cold water pipework.

2015-03-07_18-17-45

I’ve in turn created a series of clash tests, this time I have only created hard clash tests with tolerances of 0, 10, 20 and 50mm.

2015-03-07_18-12-35

The reports give interesting results. Only the report with a 0mm tolerance has reported any clashes at all. Results like these have the chance to run you into trouble if the clashes can not be resolved on site – say for example a 65mm vent pipe rising inside a 90mm stud wall and a 32mm chilled water pipe running horizontally in the wall cavity; there is no way the two services will ever fit and yet they’re not reported in Navisworks.

These settings though can also be used to your advantage. For example if you have modelled all the hot and cold water pipework to the individual fixtures, you would never be expected to coordinate pipework of that size and how can you when the architect doesn’t model the studs within the walls? Using the tolerances to your advantage you can avoid having essentially false positive clashes reported.

Customising the Backend of SP.Writer

There is a great tool that I use all the time from BIM Source called SP.Writer. I mostly used the Excel tool for consolidating parameter files that forked between structure and MEP at some point back in time. Using SP.Writer saved me quite a lot of headache in the process.

The problem is however that the Excel file is setup for out of the box shared parameter categories, so if you aren’t running OOTB shared parameter categories, the tool doesn’t work. There used to be an instructional video on how to modify the Excel file on youtube, but it’s long since been deleted and the promises of a new video haven’t come through.

[su_note note_color=”#e2e2e2″ text_color=”#333333″]Note: When I originally wrote this back in Novemeber, there was still no video. There is now a new video available to show you how to modify the file.[/su_note]

Here is how you modify that SP Writer file.

First you need to add categories to the settings tab within the excel file. This is the easy bit. It’s hidden by default and you need to unhide it.

Right click on the visible tab, select unhide

1

Select the settings tab and click OK.

2

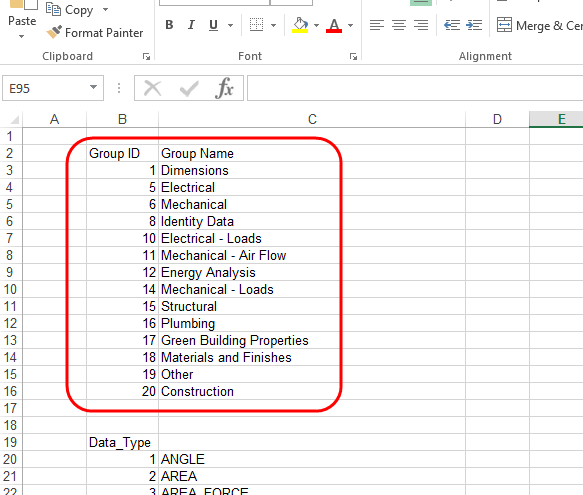
The list of parameters are at the top, the Group ID should reflect your shared parameter categories, you’ll need to insert rows to add all the parameters.

3

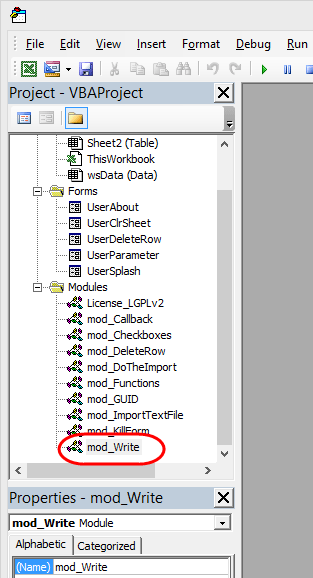
Next, you need to open the macro / vba editor using the short cut ALT + F11 once open, on the left hand side of the screen under modules, find the module name mod_Write

4

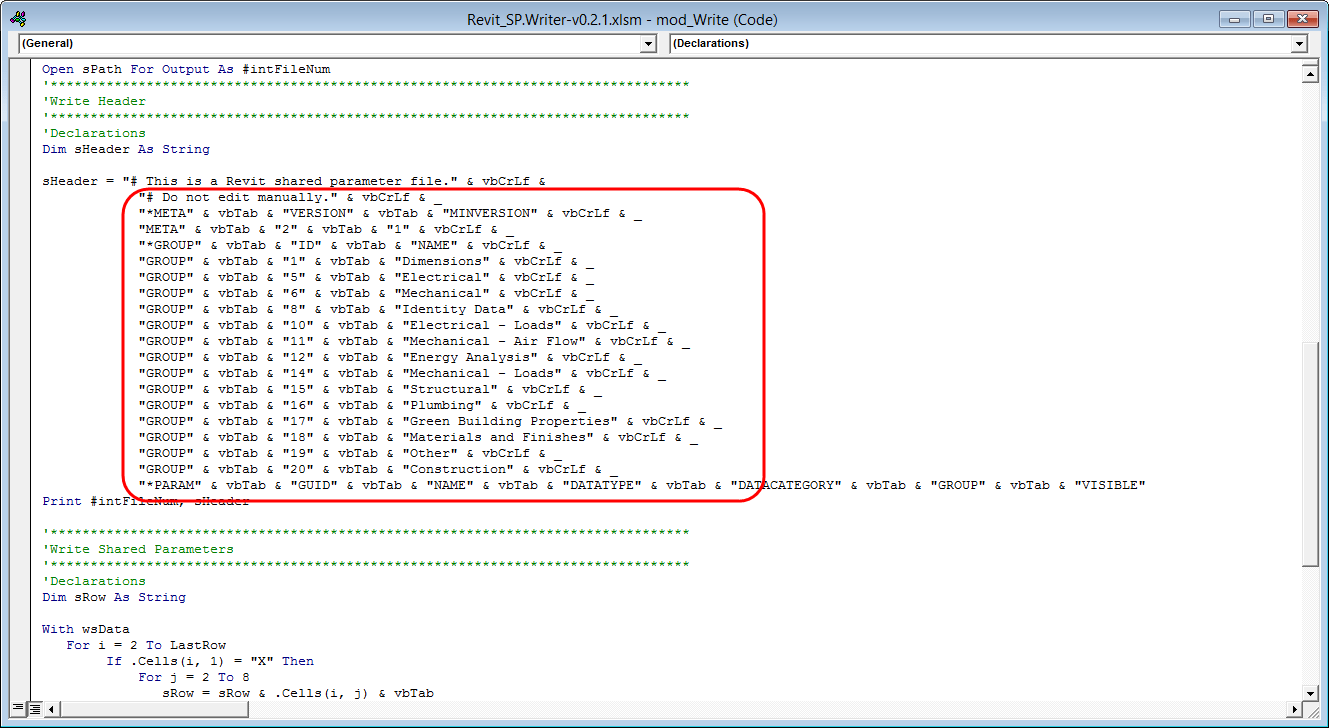
In the mod_Write code, you want to edit the section highlighted.

5

The basics of it though is that this code determines what is written to the shared parameter file, for example the line that forms the header of your shared parameter file is created by the following code

“GROUP” & vbTab & “1” & vbTab & “Dimensions” & vbCrLf

and in your shared parameter file it becomes

GROUP 1              Dimensions

The text inside the quotes “ “ is written to the file, the & adds to the string, the vbTab is inserting a tab and the vbCrLf creates a new line.

Say for example that you wanted to add a new group number 56 named Ceilings, you would write the following code:

“GROUP” & vbTab & “56” & vbTab & “Ceilings” & vbCrLf

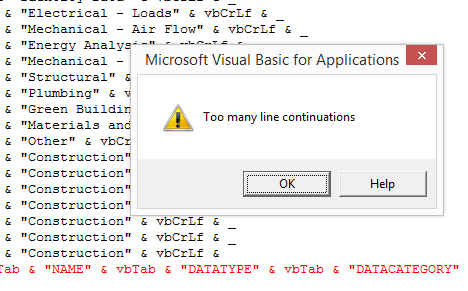
You’ve also probably noticed that at the end of each line there is an ampersand (&) and an underscore (_), the ampersand adds to the string and the underscore allows you to create a new line within the code to make the code cleaner, the problem is you are limited to creating 25 new lines in your code, so if you have a lot of shared parameter categories when you reach the 26th line you will see the following error

6

If you run into this, you need to consolidated some of these lines, but here comes the trick bit; as well as being limited to 25 lines, you’re also limited to 1023 characters per line so make sure you keep within these restrictions.

If you are removing a new line consolidating into a single line, don’t forget that you need to remove the underscore from the consolidated line.

Make sure that the category names and numbers match between the Settings tab in excel and the mod_Write module in VBA.

The next step is to find UserParameter under the Forms section, right click and select View Code

2015-03-13_10-08-42

You will see the same parameter category information in a slightly different format, once again you need to make sure that this matches your shared parameter categories that you’ve just entered under mod_Write. The format is

ElseIf Me.boxGroup.Value = “Category Name” Then
wsData.Cells(LastRow, 7).Value = 21

Once you have covered all that you should be right to go!

You can grab the SP.Writer tool from BIM Source here

Navisworks Clash Detection 101 – Part #2

Part #2 – Sets

Sets are a big part of clash detection in Navisworks, they can make the difference between a great clash report and one that is a waste of time. Simply clashing one model against another is not going to give you great results in most instances. Say for example you clash an architectural model against an electrical model, that’s all you need to do right? Wrong. Every electrical item that is recessed into either the wall or ceiling will be reported as a clash which this actually isn’t a clash, you end up with a time consuming administration overhead to manually approve clashes that shouldn’t have been reported on in the first place. This post will help you get your head around sets and how to make them work for you.

Selection sets are a group of objects selected either from the view window or from the selection tree window. You can manage sets from the sets window, if your sets window isn’t visible on screen, head to the View tab, and from the Windows button, select Set from the list.

2015-03-02_12-37-34

[su_row][su_column]2015-03-02_12-12-58 [/su_column] [su_column]The Sets window allows you to manage your search and selection sets within Navisworks.

Below is a description of each of the buttons in the Sets window.[/su_column][/su_row]

[su_table]

1 Save Selection is used to save the current selection.
2 Save Search is used to save the current search.
3 New Folder allows you to create a new folder to group sets under.
4 Duplicate is used to create a copy of the saved items.
The Add Comment is used to add comments to the saved sets.
6 Delete is used to delet the selected set.
The Sort button is used to arrange the saved sets in alphabetical order.
8 The Import/Export button is used to import and export the saved sets.

[/su_table]

When you run a search in the find items window, the search results will be highlighted in blue in the view window, as well as in the selection tree window.

When you select an object or a group of objects, they will be displayed in the Selection Inspector window along with their properties.

2015-03-02_13-25-40 [su_table]

2015-03-02_13-25-54 The Show Item button is used to view the selected object in the display window. The display will zoom in on the selected items when you click this button.
2015-03-02_13-26-01 The Deselect button is used to remove objects from the selection inspector window.
2015-03-02_13-26-40 The Export button will export the selected item to a *.CSV file.
2015-03-02_13-34-37 Save Selection allows you to save the selected objects as a selection set.
2015-03-02_13-35-18 Quick Properties Definitions allows you to add properties to the selected objects in the view window.

[/su_table]

Now that I have explained the functions of each of the window elements, I’ll show you how to put them to use.

Using the Find Items window, you can search for elements based on specific information. In this instance, I have searched for all air terminals located on level 1. The find items window will allow you to search for elements based on the element properties which includes user parameters.

[su_row][su_column]2015-03-02_14-09-27 [/su_column] [su_column]Once I have the correct elements selected based on my search, I can create a selection set in the Selection Inspector.[/su_column][/su_row]

[su_row][su_column] [/su_column] [su_column]I now have a selection set named Level 3 – Air Terminals in my Navisworks model.[/su_column][/su_row]

Following the same method, I have created a selection set of all the lights on level 3. In the next installment, I’ll explain tolerances and how they affect your clash results.

Creating Pipework Drop/Rise Hexagons

If you’re located in Australia or New Zealand, chances are you use these lovely hexagons or some other variation of them to annotate pipework dropping or rising.

2015-03-10_11-37-38

But how do you create them in Revit? It’s quite simple actually. For this example I’ll assume you have not created an annotation family before and therefore is aimed at beginners.

First, start by creating a new annotation symbol using the generic annotation template.

2015-03-10_11-41-30

In the Family Category and Parameters dialogue, change the family type to a Pipe Tag

2015-03-10_11-44-21

You can either draw up the hexagon manually or you can temporarily insert a DWG file to trace over the top of. Once you’re done, you should have your trusty hexagon sorted.

2015-03-10_11-48-05

To add the text to your symbol, you want to use labels. You can find the label tool on the create panel of the ribbon.

2015-03-10_11-49-38

When creating the labels, you will need to select the parameters that you want to pull the data from in your model – we will be using Diameter and System Abbreviation. The reason why I use System Abbreviation is that it will automatically propagate to all pipework in the system where as other parameters do not. Don’t forget to adjust the text style of the label to suit your drafting standards.

2015-03-10_11-52-59

The next step is to apply a visibility setting on the filled drop and rise indicators. Simply select the triangle and and in the properties window, look for the Visible parameter. Select the small square at the end of the line (marked at 1), you will now have an option to select parameters to apply, yours should be empty.

Select Add Parameter and then create a new parameter with the name RISE. Make it a Type parameter and sort it under Graphics.

Repeat the process for the drop indicator.

2015-03-10_12-07-46


Finally open up the Family Types dialogue

2015-03-10_12-12-24

Create a new family type called RISE and then check the RISE parameter and make sure that DROP is unchecked. Do the same again creating a family type named DROP and check the DROP parameter, making sure that RISE is unchecked.

If you want to get tricky, you could use a not( ) formula. Simply type in the forumula

not(RISE)

in the drop parameter. When RISE is checked, drop will be unchecked and when RISE is unchecked, DROP will be automatically checked.

2015-03-10_12-13-19

And that’s it! Once you’re done, save your new family and add it to your template.

When tagging your pipework, you need to manually select if it is a dropper or riser by selecting the family type from the properties window, the size and the service however will be automatically filled out for you.

For the System Abbreviation parameter to be picked up, you will need to have this filled out in your pipe system settings for each service, note that it is simply listed as Abbreviation in the system settings.

2015-03-10_12-00-43

If you don’t use systems (you should be using them!) and rather you use pipe types to define your service, the System Abbreviation parameter will not work and you can use a shared parameter instead to populate the label within the annotation.

Navisworks Clash Detection 101 – Part #1

Part #1 – The Clash Detective Window

To the average engineer or modeller, Navisworks and clash detection go hand in hand, some people think that they are one and the same. If you’re not familiar with the terminology, clash detection is a process that identifies interference between elements in your model where as Navisworks is an Autodesk product that facilitates automated detection of the interferences between modelled elements. These interferences, or clashes may be between different models or within the same model, they could be between disciplines or within the same discipline.
The concept behind clash detection during the design process is that you can identify and fix problems before construction begins, therefore saving time and money down the track. Provided that it is configured correctly, Navisworks can help to speed up the process and reduce human error during model inspection by running automated clash reports.

The problem with Navisworks however is not everyone knows how to use it effectively. Maybe you’ve been to training with a reseller in the past and you walked out the door still scratching your head. After spending a whole day working on 4D timelining, 3 hours showing you how to animate an automatic door in Simulate and less than an hour spent learning the very basics of clash detection in Manage or maybe you’ve had no training at all? Either way you’re only just barely making your way through your clash detection sessions.

Over my next few articles I will outline a few of the clash detection basics to get you more confident in your adventures into clash detection, I’m not going to claim to solve all your clash detection woes, but whatever your experience, it’s always good to have something to refer back to.

In this first installment, I’ll explain each of the parts of the Clash Detective interface.

[su_row][su_column]2014-11-26_21-01-54 [/su_column] [su_column]The Clash Detective window allows you to specify rules and options for undertaking clash tests. In this window you can view results and generate clash reports.[/su_column][/su_row]

[su_row][su_column]2014-11-26_21-02-41 [/su_column] [su_column]The Test Panel is where you will find all of your clash tests. The test panel isn’t displayed by default, you need to click on the Add Test button in the clash detective. When you select the Add Test button, a new clash test will be created and added to the test panel.[/su_column][/su_row]

[su_row][su_column]2014-11-26_21-11-43 [/su_column] [su_column]Under the Rules tab, you can define rules in which Navisworks will use to ignore clashes, by default there are four pre-defined rules shown under the rules tab.[/su_column][/su_row]

[su_row][su_column]2014-11-26_21-02-41 [/su_column] [su_column]In the lower half of the clash detective window we have a section with a few tabs, the Select tab is the default view in the clash detective window. In this tab you can define the clash test by selecting multiple sets of items at a time. You could clash a whole model against a whole model, however this would be a very inefficient process, instead you can test clashes between different selection sets of elements in the model.

The Selection A and Selection B areas display all the items in a hierarchical list that replicates the selection tree window. You can select objects from these areas that will be tested against each other during a clash test.[/su_column][/su_row]
Beneath the selection windows are a group of buttons which allow you to change what geometry is clashed in the test.

[su_table]

2014-11-29_7-59-59 When Surfaces is selected, surface geometry is included in the clash test. Surfaces is selected by default when you create a new clash test.
2014-11-29_8-00-15 When Lines is selected, line geometry is included in the clash test.
2014-11-29_8-00-28 When Points is selected, point geometry is included in the clash test
2014-11-29_8-08-55 Self Intersect is used to test the selected object against itself for clashes
2014-11-29_8-09-18 The Use Current Selection button is used to select objects directly in the scene view for clash tests
2014-11-29_8-09-31 The Select in Scene button is used to highlight the elements selected in the clash test. They will appear in blue when selected.

[/su_table]


[su_row][su_column]2014-12-02_13-06-32 [/su_column][su_column]The Results tab is where you view the clash results. This tab is divided into three parts, the Results pane, Display Settings panel and the Items panel. By default the Display Settings and Items panels are hidden. They can be accessed by clicking on the panel title which is highlighted in the image.

The Results area displays a list of clash results in a tabbed format showing the name of the clash, the clash status, the date found and the description of the clash. If the clashes have a saved viewpoint, then the viewpoint icon will be displayed in the viewpoint column as well.[/su_column][/su_row]

[su_row][su_column]2014-12-02_12-57-37 [/su_column][su_column]After expanding the Display Settings panel, you are provided with options to change which clash is highlighted, choose not to highlight the clashes at all, dim the other elements within the model so you only see those that are related to the particular clash as well as adjust basic viewpoint and simulation settings. [/su_column][/su_row]

[su_row][su_column]2014-12-02_13-06-22 [/su_column][su_column]Hidden at the bottom of the results tab is the Items panel. Once expanded you can view information on the clashing objects. The clash information displayed will depend on the select clash configuration.[/su_column][/su_row]

[su_row][su_column]2014-12-02_13-12-22 [/su_column][su_column]Finally, in the Report tab you can adjust options for generating clash reports. The generated report will contain the details of all the clash results for the selected test. The report tab has three sections; Contents, Include Clashes and Output Settings.

In the Contents section, you can select the contents of the report, such as the date found, item numbers, grid locations, coordinates of the clash among others.

The Include Clashes section allows you to filter by new, active, reviewed, approved or resolved clashes.[/su_column][/su_row]
The Output Settings section allows you to select the output format of your clash reports. It allows you to select either the reports from the current clash test or from all clash tests either as a combined or separated format. You can also choose from HTML, XML or recorded viewpoints as your clash report format.

In the next installment, I’ll build on what I’ve shown today and explain how to create selection sets to get better results from your clash tests.