project setup

Placing Multiple Views on Sheets With Dynamo

Keeping on the theme of Dynamo and drawing setup, I had a series of MEP models that I needed to setup that had 2 views that needed to be placed on each sheet, a main view and a smaller inset view.

I started from my sheet generation Dynamo graph and ran through a number of different options to enable to graph to place multiple sheets on views in the correct location.

The method I found posed the least problems in the process was to add an extra column to my Excel file for the names of the inset views

As a bit of ground work, I needed to figure out where I wanted my views to be located, so I made up mock sheet with the views placed where I wanted them to sit on the sheet

I then threw together a quick graph that allowed me to select the viewport I’ve placed on the sheet with the Select Model Element node and running that through the Rhythm node Viewport.LocationData I can get the centre point of the viewport box. This centre point of each viewport will be the values used when we move the viewports later.

Once the viewport locations are picked up, we can get to modifying our original sheet creation graph.

The first modification that we need to make is with the additional column in Excel. Copy the original section of the graph and change the code block to 3 so that we are reading from column D of the excel file.

The next step we filter our views again, but this time we’re filtering two separate lists of views, things get a little messy but it’s still reasonably easy to manage. Note that I dropped a List.Clean node in the mix as I was having views return with no data, the List.Clean node removed empty and null values.

Remember that if you’re going to clean the list, you need to feed the other nodes with the cleaned list, do not mix and match between clean and unclean lists, otherwise you’ll have a bad time.

Now we should have two lists of element ids, one for our main views and another for our inset views.

Our main views get fed through the same series of nodes from the moving views on sheets post.

So while all of this is happening, where the output of the Sheet.ByNameNumberTitleBlockAndViews node shoots off a second time to tell our insets what sheets they need to be placed on.

The problem you will stumble into when placing views in this method is that if the sheet hasn’t yet been created, the inset views won’t be placed. The way that I decided to handle it was by using a Passthrough node from the Clockwork package. The Passthrough node implements an order of execution. It will wait for the node threaded into the waitFor input to complete before sending on the data threaded into the passThrough input.

I fed the Passthrough node with the results of moving the main viewport on each sheet, once this main views have been moved the sheet numbers are sent through to the Viewport.Create node.

Running the script, we end up with views placed exactly where they want them. The example GIF below is recorded in real time and runs for 14 seconds from start to finish, which includes checking each sheet has been correctly created.


This is great and all, but what happens when you have two difference types of “main” views, one where you want placed along with an inset like the above example and another where you ant the views placed centrally?

The way I found best to handle this scenario is to add a String.Contains node along with an if node to control the location of the viewports depending on the name of the view itself.

In this particular example, the names of the “main” views are being checked for if they contain the string Platform Level_ and if they do, the views are being placed centrally on the sheet, otherwise they’re being placed offset from centre to allow for the inset view to be placed on the same sheet.

The nodes labelled platform view x, main view x, platform view y and  main view y are simply code blocks that I have renamed so I know exactly what they are.

Practical Dynamo – Moving Views Based on Another View

Okay, so we’re on a roll with practical Dynamo usage. Last week we looked at placing views centrally on our sheets, but what if you didn’t want the view centrally placed? What if you wanted views placed in the same location on all sheets maybe in the top left of the page?

As always with Dyanmo, there is a solution for that. Again we’re going to be using the Rhythm custom node package to get the work done. This method requires one sheet to be used as a template that all the following sheets are based on.

In our example this time around, where we want the view located is in the top left (shown on the left) but by default Dynamo places our views in the bottom left (shown on the right)


This workflow can be easily integrated into our previous graph where we created new sheets in Dynamo using Excel however for this example we’re going to create a standalone graph. For this example though, it’s assumed that this time around though that you already have all the sheets and views required created.


First we start by taking all of our sheets, we do this simply by using Categories and then All Elements of Category, after that we get into our Rhythm nodes.

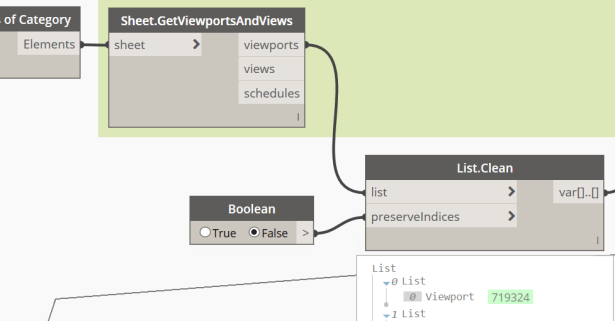
First we get a list of all of the viewports on our sheets using the Sheet.GetViewportsAndViews node. Run the list through a List.Clean node to remove the empty list entries. This leaves us with just the viewport entries.

Meanwhile, we also need to get the viewport from our template sheet. In this instance our template sheet will be drawing H101 which we’ll select using the Sheets node and then we’ll feed that node into the Sheet.GetViewportsAndViews node which are both from the Rhythm package.

And finally we feed our data lists into the Viewport.SetLocationBasedOnOther node, which again is from Rhythm. It’s as simple as that.

Hit the run button and watch the magic happen.

Practical Dynamo – Moving Views on Sheets

For those of you that read through my previous post last week on creating sheets using Dynamo, you might have come to the end of the post only to realise that the views haven’t placed where you want them to be on the sheets.

For example, my sheet with the automatically placed view now looks like this

The first method I’m going to use nodes from both the Rhythm and Lunchbox packages which you can download from your package manager. Simply install the latest version.


The Rhythm package has some super useful tools for a whole range of different actions in Revit, but today we’re going to focus on the nodes that can help us manipulate the location of our views on the sheet.

To get started, we use the Sheet.GetViewportsAndViews node, we want to feed the sheets from our previous steps into this node and the node will give you the viewports, views and schedules as separate outputs. For this exercise, we’re only interested in the viewports. As always, while you’re reading through just click on the images to see them full size.

Next you need to use the Viewport.LocationData node from Rhythm. The outputs from this node are

bBox which returns the minimum (bottom left) and maximum points (top right) of the viewport bounding box.
boxCenter which returns the centre point of the viewport bounding box
boxOutline which returns the start and end points of each side of the viewport bounding box

For this example, we’re going to use the boxCenter option because we’re going to get tricky with it a bit later on. For those earlier that were wondering what the Use Levels option actually on the nodes, as you can see in my animation it changes the level of the list that we’re working with. Without the Use Levels option you would need to either use GetItemAtIndex or List.Deconstruct to get the data that you want to manipulate.

Next use the Points.DeconstructPoint node from the Lunchbox package, this will deconstruct your point into it’s individual X, Y & Z coordinates.

Now this is where we get too smart for our own good. I want my view to be placed in the middle of the available space on my titleblock. For my particular titleblock I know that the centre point is located at 378, 297 (yours may be different) and we already have the centre of the viewport from our Rhythm node.

To find how far we need to move the viewport, we need to subtract the view X centre value from the sheet X centre and the view Y centre value from the sheet Y centre. The code block is simply values I’ve chosen, you could think of them much like a parameter in a family.

The next step is to move the views. The vector gives the distance in X & Y coordinates that the view needs to be moved, the Vector.ByCoordinates and Element.MoveByVector nodes are both standard nodes within Dynamo.

And finally, the whole thing is tied together by pushing the viewport elements into the Element.MoveByVector node via a List.GetItemAtIndex, from which we’re taking the list elements at index 2.

Now sometimes when I run this script, I’ll see the following “Attempt to modify the model out side of transaction” error.

There is a simple solution to this. Just save your changes in Dynamo, close Dynamo and then re-open. Simply run the script again and everything will work!


An overview of our extension to the original graph from last week, I’ve highlighted the nodes from custom packages to make things a little easier as well, Captain BIMCAD actually called me out on last week’s example for not grouping my nodes!

Practical Dynamo – Generate Sheets from Excel

I was discussing Dynamo workflows with good old Captain BIMCAD the other night and we got to the topic of project setup.

Personally I don’t use Dynamo in my everyday project setup workflow, I use Ideate BIMLink, Omnia Scope Box Synchroniser and Sheet Duplicator but if you don’t have access to this software; especially BIMLink as it’s a bit pricey, Dynamo is definitely a viable option. Here’s how to get it done.

First we need to create a list of sheets in Excel with Name and Number information. Starting with a blank workbook in Excel, create a list with sheet numbers in column A and sheet names in column B.

From here we need to generate new sheets with this Excel data. Don’t forget the File.FromPath node, you can not feed the File Path node directly into the Excel.ReadFromFile node. Note that the name of the sheet in the Excel workbook is case sensitive. You can click on the image to view in full size


The next step is to remove the headers from our Excel file. They’re useful to us as it makes the Excel file more readable, however they need to be removed when used in Dynamo.

To achieve this we’re doing to use 2 nodes, List.FirstItem and List.RestOfItems.


Next we need to transpose our list so that we can feed in our sheet details into the sheet creation node. You can see once we run the list through the List.Transpose node that we now have a list of sheet numbers and a list of sheet names which sets us up for our next step.

Most of the magic happens at the next node which is the Sheet.ByNameNumberTitleBlockAndView node.

For the node to work, we need to input the sheet name, sheet number, the titleblock family which you can see how we achieve this in the next screenshot.

While you’ve been reading, I’ve taken it upon myself to generate some views in our model and add them to our original Excel file.

We can copy what we’ve already created in Dynamo for the sheet names and numbers and we simply take index 2 from the list, giving us the view names. Note that these will be case sensitive.

The next step is to actually find those views in the model to drop onto the sheets. We do this by creating a list of all the views within the model. Take the Categories node and select Views from the drop down, feed this into the All Elements of Category node and then finally feed this into an Element.GetParameterValueByName node. For the parameter name, we want to get the value for the View Name parameter.

From here we need to search the list of view names in Excel with the list of view names in the model. To do this, use an IndexOf node.

When you run this though, you’ll end up with a result of -1 instead of a list of indices. To fix this, change the level of list in the node. To do this, click on the right arrow on the element input of the node, select Use Levels and select @L1. Run the graph again and you’ll see the list of indices.

But what happens if you have a model where you don’t have the views setup yet? In our example we don’t have a view for the cover sheet or site plan yet which is why the view name is represented as null. You can see that the null view names give a -1 index result. If we feed this data into the Sheet.ByNameNumberTitleBlockAndView node as it is, it won’t create the sheets with the null views.

You can still use the same node, but there is a trick to it.

First, grab the Manage.ReplaceNulls node. Feed the list for views into the data section.

Next, create an empty drafting view, I’m just going to leave mine as the default Drafting 1. Feed the ReplaceWith input of the Manage.RemoveNulls node with the string Drafting 1.

Now when we search our views in the model, we’ll have the correct indices returned.

But hold on there a minute! We can’t drop drafting views on multiple sheets, how is this even going to work? To be honest, I’m not quite sure why but if you feed an empty drafting view into the Sheet.ByNameNumberTitleBlockAndView node it will generate an empty sheet. Whatever the reason, that’s a win for us!

Simply feed Manage.ReplaceNulls into the Sheet.ByNameNumberTitleBlockAndView node and we’re done!


If you’ve had automatic run selected, you’ll have a nice set of shiny new sheets created, otherwise simply click run and watch the magic happen.

Blink and you’ll miss it!

The end result. Click the image for the full resolution version.